Your new post is loading...

From
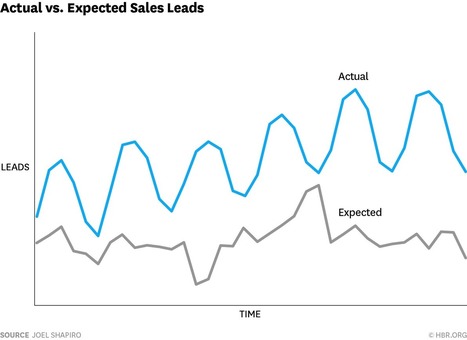
hbr
Slick graphics can make useless information seem important.